
Alice in Wonderland
There is a divergence between financial market volatility and the stability of the macro-economic data. This is both a reassuring and a worrying sign, depending on the approach to the economic and financial systems. Although, as is often said, the financial markets have anticipated 15 of the last 10 recessions, it is fair to include changes in financial market trends in the macroeconomic scenario. In particular, in this issue of Investor Insights we will see that the rise in interest rates that caused the equity market correction at the beginning of February can strongly influence the growth trajectory of an economy. Interest rates affect an economy via three different channels - we will explore all of them in the second part of this article.
Let's start by looking at the global economic situation. All the surveys carried out at the beginning of this year reflect a high level of confidence in the future. This is true for both consumers and entrepreneurs. The moderate optimism that accompanied the economic recovery is gradually turning into unequivocal optimism.
Unemployment rates are continuing to fall in the major economies and, despite some already very low rates, job creation remains strong. This favourable environment gives confidence to consumers who believe in a bright future.
For entrepreneurs, the sentiment is also positive. The order books are well filled, leading indicators are at high levels - and all of this is backed up by solid economic data. Last year, global growth was strong (+3.7%). Industrial production has strengthened overall; the rate of capital utilisation is steadily increasing, and an investment cycle is starting to take shape. All of this translates into higher company earnings.
In this economic paradise, however, some data is showing signs of fatigue. Nothing very worrying at this point, but it indicates that the business cycle is changing as time passes. It is now in its late phase and is becoming more fragile.
The situation is very similar in the United States and Europe. Against solid data, economic growth forecasts have been revised upwards for 2018 and 2019. China is slowing down nicely, as planned. As the government announced, growth should be around 6.5% this year. Finally, Japan remained true to itself, remaining weak but stable.
If the situation described above is correct, it is almost impossible not to be positive about the future of economies and financial markets. However, good economic data at the end of a business cycle is often synonymous with nascent inflationary pressures and rising interest rates. This logical consequence worries investors and was the cause of the financial market correction observed in February. We will return to this in more detail in the second part of the article.
In addition to rising interest rates, two political events recently disturbed investors' peace of mind: the Italian elections gave victory to populist parties and President Trump announced a plan to impose tariffs on steel and aluminium imports.
In Italy, the number one economic risk for the Eurozone, the election results clearly reflect the dissatisfaction of a large portion of the population – and it is not only caused by the economy and the north-south disparity. Even though the economy is still recovering and unemployment is too high, consumer confidence and business sentiment are showing renewed optimism. The dissatisfaction originates in the world of politics. First, the election results sanctioned previous governing parties and show that a majority of Italians are unhappy with the inability of these political parties to change Italy. Second, Europe leaves Italy alone to manage the massive influx of migrants, but gives itself permission to stick its nose into Italy’s fiscal affairs, fuelling anti-European resentment. During the euro crisis a few years ago, Europe imposed austerity without leaving much room to manoeuvre. Of course, Italy has failed to implement the necessary economic reforms that Europe is demanding and therefore remains fragile. Be that as it may, the current situation is challenging and it is looking more likely that we will see increased tensions in the political relations between Europe and Italy. At the time of writing, although uncertainties about the new government are in full swing, financial markets remain confident.
This may be due to the second political event of international importance, namely President Trump's desire to impose tariffs on aluminium and steel. This has led to the resignation of a direct adviser to the President, Gary Cohn, one of the last "globalists" in this administration.
The U.S. trade balance deficit is growing as illustrated in exhibit 1. In January, the deficit reached more than $50 billion because of an increase in imports of non-petroleum goods and a deterioration in the balance of services. It is important to note that the petroleum product balance has almost evened out thanks to shale gas. The growing deficit in the overall trade balance therefore reflects a deterioration in U.S. international competiveness, indicating this is not just about steel and aluminium. It is becoming more probable that we will see other tariffs emerge.
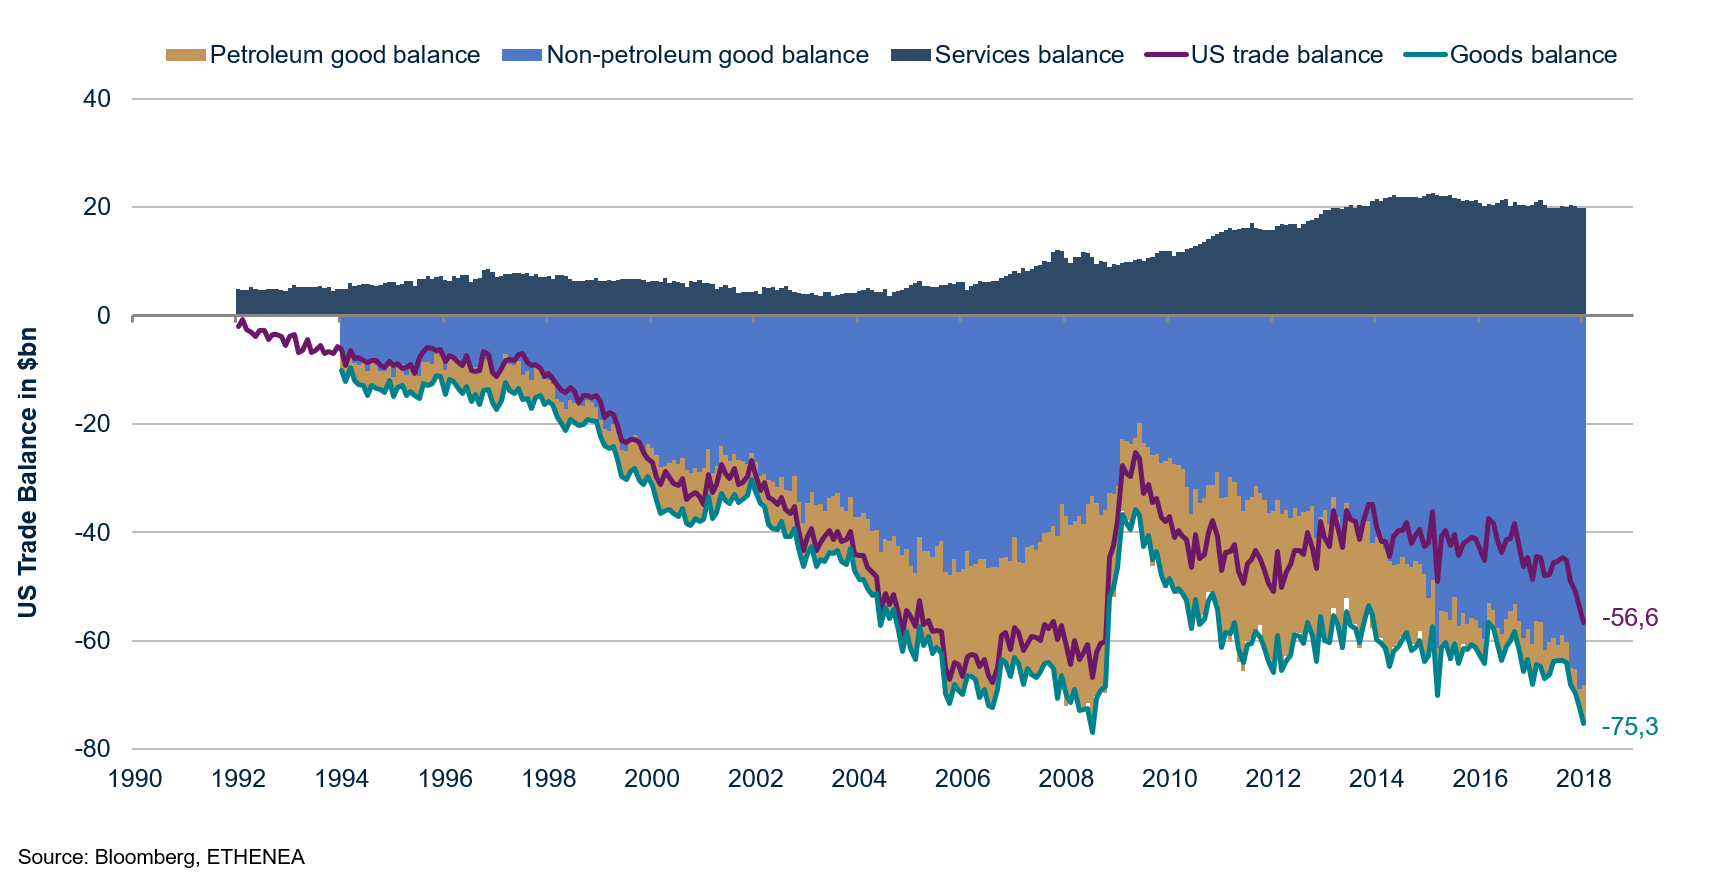
Exhibit 1: US trade deficit is worsening
For some time now, the global economic cycle has been supported by an industrial cycle, which is largely responsible for the recent increase in international trade. Imposing tariffs is never really a bright idea in times of global supply and production chains, but it is now particularly awkward and dangerous. The risk is that the investment cycle just starting might well be nipped in the bud.
While the data does not show signs of weakness, we notice that growth drivers are changing and this leads to a more fragile growth composition. U.S. GDP growth is gradually becoming more dependent on investment rather than on private consumption. In our view, there are two reasons why this substitution is set to become more important in the coming quarters. First, the labour market dynamic is losing momentum. Unemployment rates are declining at a lower pace than they did before. This means that the increase in the number of new wage earners, and therefore consumers, is losing momentum. Second, the global manufacturing recovery and the rapidly rising capacity utilization rate result in higher investment needs. In the last two years, capital expenditure (capex) intentions have improved markedly and are already at a high level, as confirmed by U.S. indicators.
The growth fragility stems from the investment cycle, a notoriously volatile GDP component that is dependent on the growth outlook and on the interest rate level. The growth outlook is already positive and interest rates are set to rise, making investment gradually less profitable.
According to its dot plot, the Federal Reserve (Fed) is set to raise rates three times this year - and we expect to see the Fed Fund target rate reach more than 2% at the end of 2018. The European Central Bank (ECB), while not yet in hiking modus, will stop its Quantitative Easing (QE) program this year and will probably raise rates from next year onwards. While this is not a surprise to anyone, several modalities of the hiking cycles remain uncertain. The two most obvious ones are how fast will it take place and how high the interest rates will eventually go.
Inflation targeting is the unquestioned and dominant goal pursued by central banks nowadays. In order to establish their credibility within a well-defined framework, central banks explain their various actions in the context of price stability. The ECB, for instance, officially did not launch a QE programme to help the European periphery survive the euro crisis, but only to maintain price stability as deflation was looming!
This strict interpretation of inflation targeting has changed the meaning of inflation. It is no longer understood as what it is, i.e. a measure of change in consumer prices, but is interpreted as a monetary policy indicator. Inflation has become a binary variable that divides the world in two, whether it is above or below the magic 2% figure. Because of the key role played by central banks in the aftermath of the Global Financial Crisis (GFC), and the strengthening of their credibility as a result, their communication is analysed down to the last detail and investors have developed a Pavlovian reflex about inflation. Either inflation is below the magical figure and monetary conditions are loose and stimulative, which is good for the economy and the financial markets, or it is above it and monetary conditions are tight and restrictive, which is bad for the economy and the financial markets.
From this perspective, it is not surprising that when inflation is close to passing through to the other side, investors are like Alice in Wonderland when she steps through the mirror, anxious and excited to discover a new world where the rules are different. In early February, when the U.S. employment data was released and wages increased by 2.9% y/y, investors saw the white rabbit saying “Oh dear! Oh dear! I shall be too late” and they feared the time for higher rates had come. As we are increasingly likely to follow the rabbit into the 2% plus inflation world of “restrictive” monetary policy, we would like explore the impact of higher interest rates on the economy. Who pays interest rates and to whom? Who is indebted, ultimately who is at risk, and how high can interest rates go?
Money for nothing and debt for free
The Fed is leading the interest rate dance and it is in the United States that the risk of inflation is most palpable. That is why we will concentrate our analysis on this country. But before we get to the heart of the matter, we would like to take the time to outline some key notions that will accompany us throughout our journey.
At the macro level, the economy is populated by seven activity sectors; all of these except the vaguely defined “Rest of the World” are domestic. We are interested in the domestic ones, as we want to evaluate how the U.S. domestic sectors can live with higher interest rates. The domestic sectors are the households and non-profit institutions serving households (in short the households), the nonfinancial non-corporate business (sole proprietorships and limited partnerships), the nonfinancial corporate business, the financial business, the Federal government, and finally the State and local governments.
Exhibit 2 summarizes, in a few figures, the situation of our six business segments in 2007, prior to the GFC, and in 2016. It shows debt levels, interest paid, the effective interest rates paid on the debt, the gross primary income plus an estimate of how high interest can go.
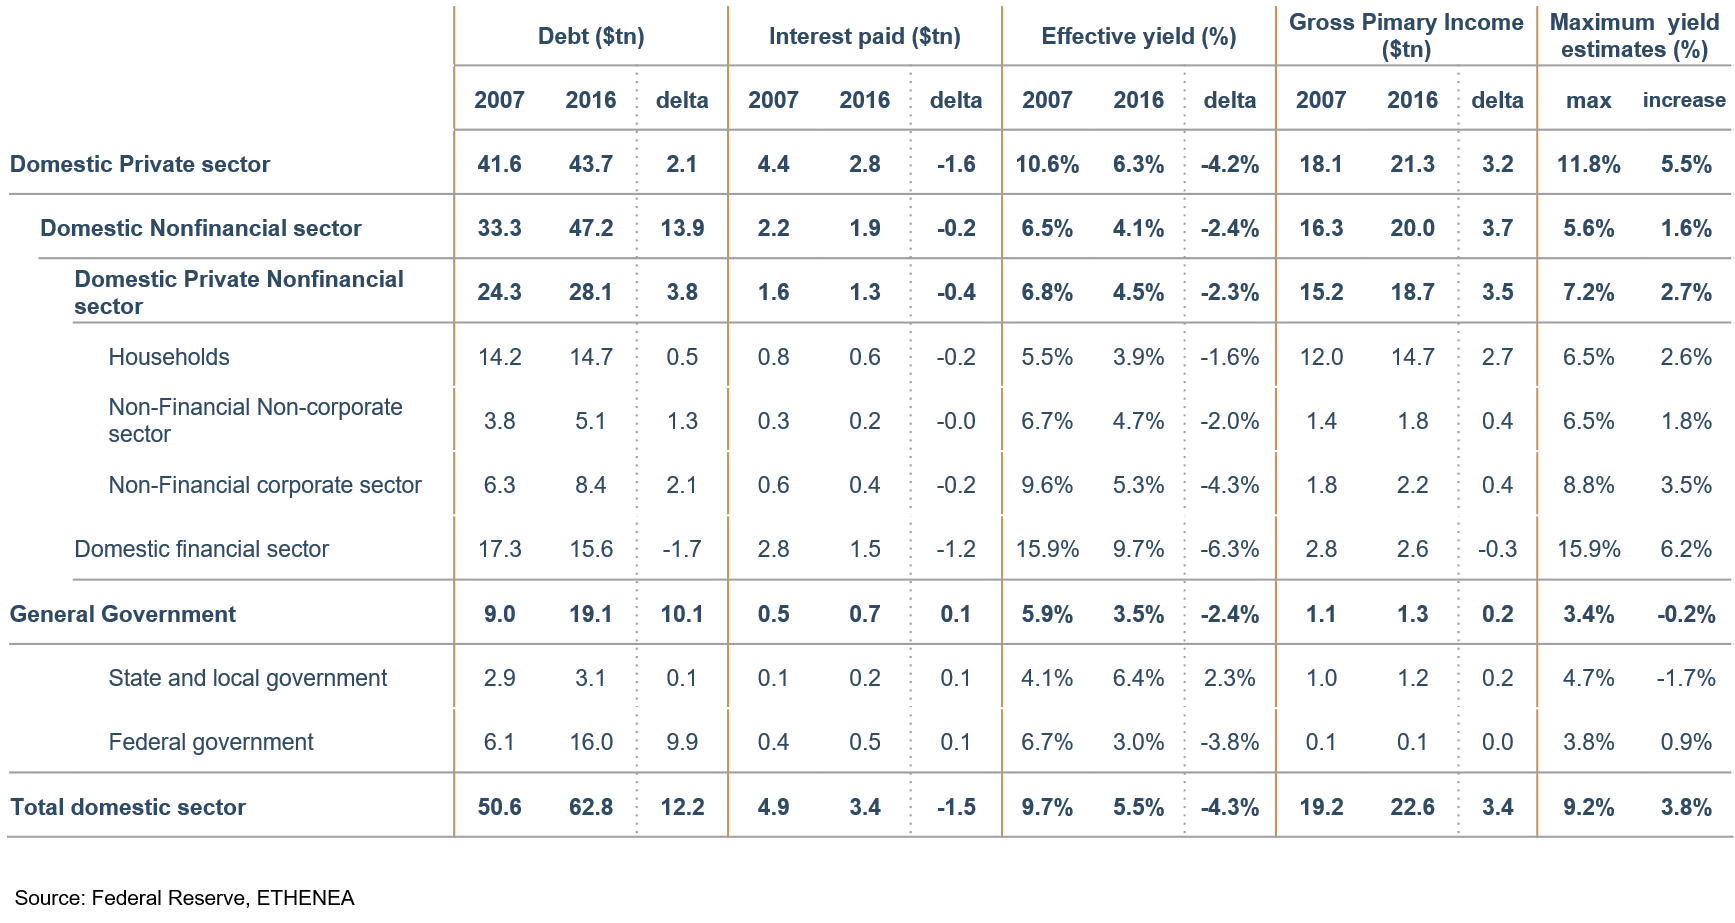
Exhibit 2: Debt, interest and capacity to pay before the GFC and now
Our first observation concerns the evolution of total domestic debt, which increased by $12.22 trillion during the period under review, to reach $62.8 trillion at the end of 2016. This increase in total debt is mainly due to the increase in general government debt (local, state and federal), which more than doubled, increasing by $10.1 trillion to $19.1 trillion. The U. S. financial business sector, which was the main actor in the GFC, saw its indebtedness decrease by $1.7 trillion to $15.6 trillion. Nevertheless, it remains the second most indebted sector. Finally, the broad domestic non-financial business sector debt is increasing. Exhibit 3 shows the debt trajectory of the various activity sectors, highlighting the central role that government plays in rescuing not only households but also the financial business sector, and therefore the financial system.
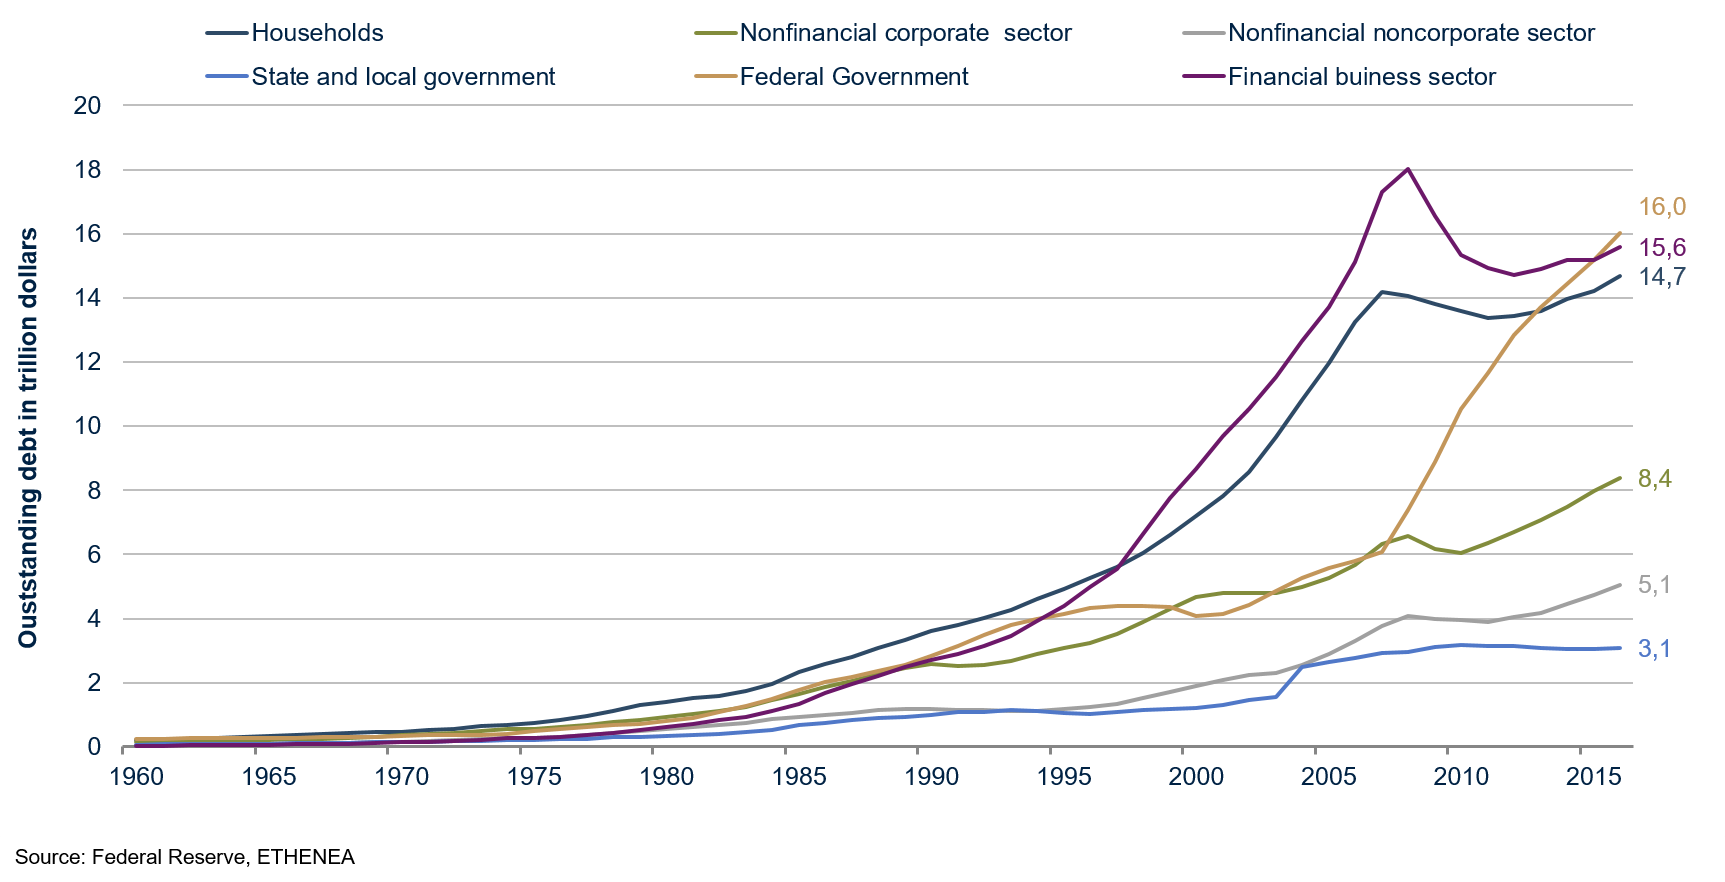
Exhibit 3: Debt per activity sector
Paradoxically, this increase in debt, and therefore the deterioration in the balance sheet liabilities of all economic agents except the financial business sector, took place in an environment of falling interest rates. This is a counter intuitive development, as interest rates should rise to compensate for higher risk. It once again shows the power of monetary policy on interest rates. Let’s not forget that it was in July 2016 that the 10-year U.S. Treasury yield reached its lowest level, spending a few days below 1.4%. This decline in long-term interest rates is part of a very accommodating monetary policy with massive liquidity injections, dovish forward guidance, and short rates that have never been so low. In exhibit 2, the change in the effective interest rate paid on total debt decreased from 9.7% in 2007 to 5.5% in 2016, the lowest rate since the since the statistics were first recorded (early 1960s). This massive fall in interest rates more than compensated for the rapid rise in the debt level, so that total interest paid in 2016 was lower than in 2007. It moved from $4.9 trillion to $3.4 trillion as shown in exhibit 4 while, at the same time, the debt increased by $12.2 trillion or more than 24%! After the dire straits that followed the GFC, the central banks sang ‘money for nothing and debt for free’ in unison!
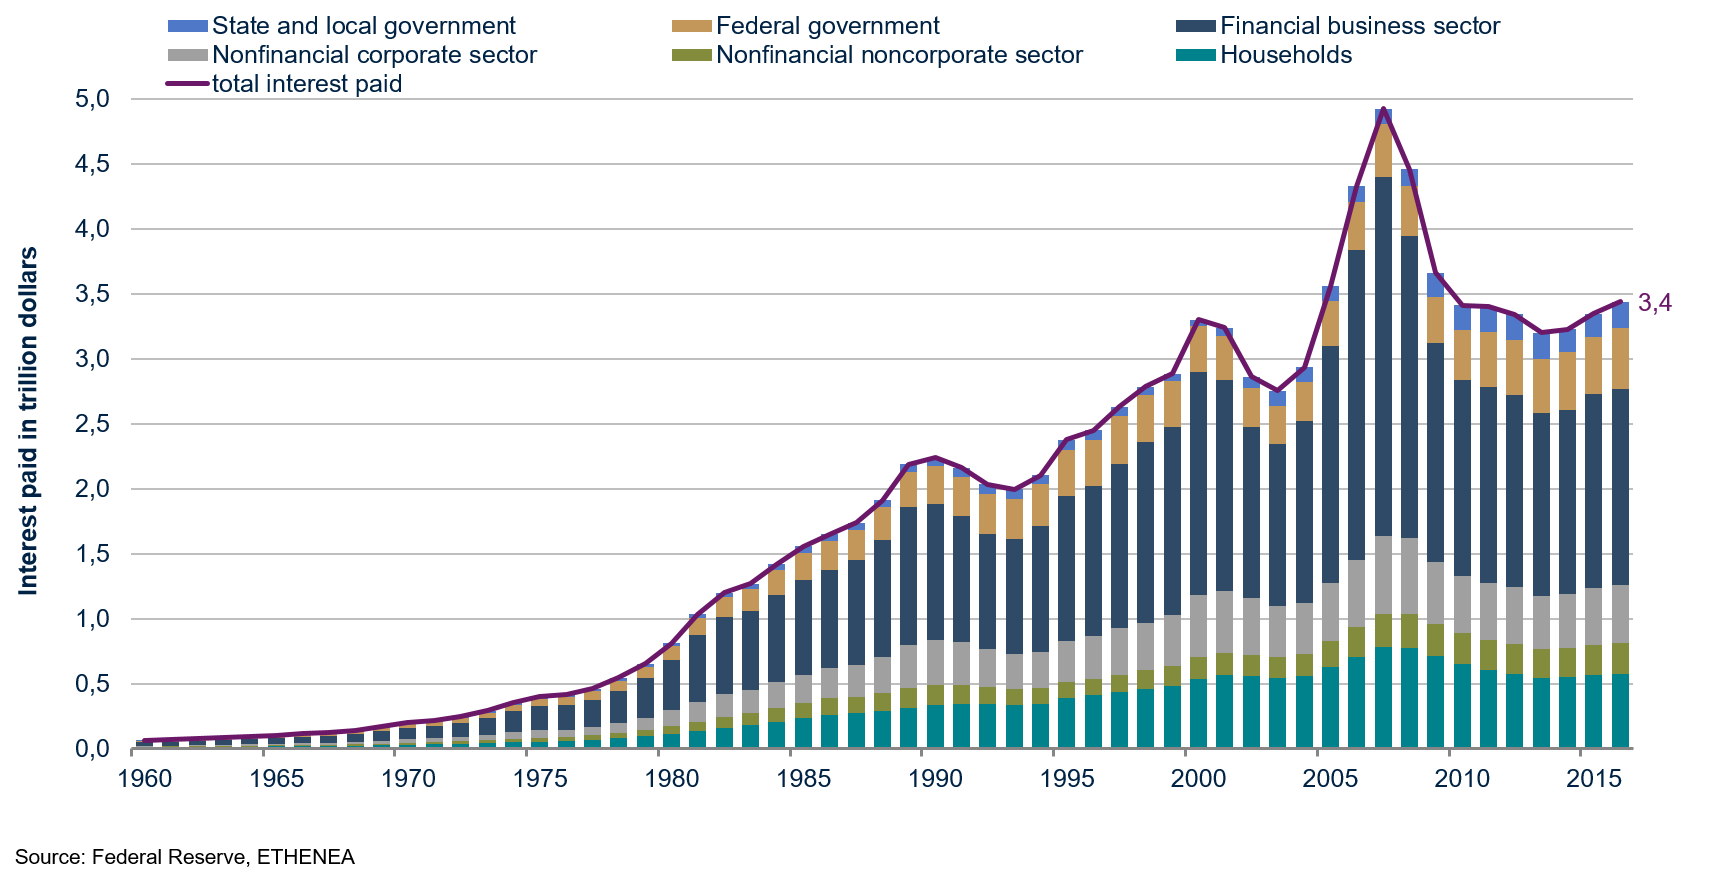
Exhibit 4: Interest rate paid per annum and per sector
Monetary policy has had three positive effects on economic recovery. First, it has reduced the interest burden of the U.S. economy from $4.9 trillion to $3.4 trillion or from 34% to 18% of GDP between 2007 and 2016 respectively. These savings were used to repair balance sheets and to smooth consumption in the downturn.
Second, it has allowed the government to rescue the financial system and the economy as a whole for “free”, as general government debt increased by $10.1 trillion but interest payments remained virtually unchanged.
Third, in addition to these direct and measurable effects, the maintenance of low rates for longer has also pushed up the value of assets and thus household wealth, boosting consumption. Exhibit 5 clearly shows the close link between changes in household wealth and stock market performance. It is not a big leap to associate the good performance of the financial markets – government bonds, corporate bonds, equities and real estate – with the level of interest rates. Growth in wealth also reduces the need for savings and therefore increases the capacity and willingness to consume and thus stimulate growth.
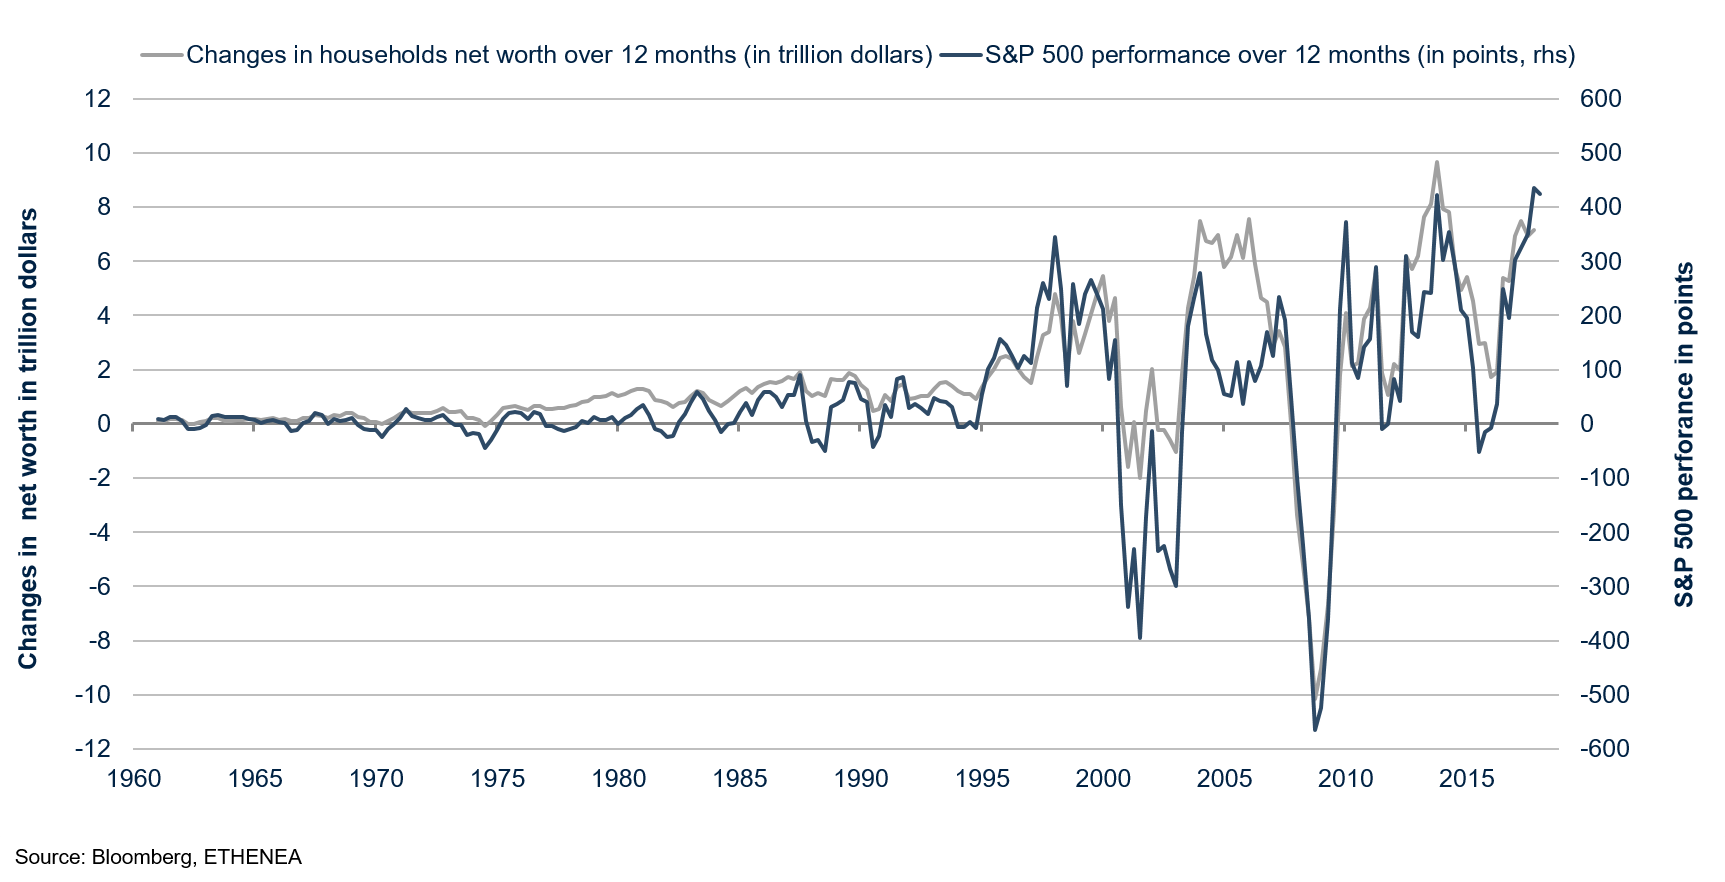
Exhibit 5: Household net worth increasingly tied to financial market
Since the reverse movement in interest rates has begun, the positive effects described above have disappeared. Let's look at them one at a time to see where the risks lie.
The interest burden as a proportion of income, as measured by GDP, is 18% - one of the lowest recorded, suggesting that the economy is ready to absorb several rate hikes without raised eyebrows. To be more precise, we have estimated the sectoral interest burden as a proportion of the gross primary income of each economic agent. The gross primary income term we just coined is nothing more than an estimate of the Earnings Before Interest and Taxes (EBIT) often used to calculate a company's ability to meet its interest rate payment. Although we use macroeconomic data from the System of National Account (SNA) and not from the U.S. GAAP accounting methods, the names may differ but the spirit remains the same. The gross primary income takes into account the differences in earnings sources, such as taxes for governments, sales for firms, and wages for households in a coherent way in order to estimate the capacity of each sector to pay interest. Once again, the same question can be asked: economic sectors can absorb several rate increases but how many are too many?
In the last two columns of exhibit 2, we try to answer this question in the following way. If the GFC was caused by the interest burden paid by the various sectors, what interest rates today would put these sectors in the same position? According to this logic, we have estimated what level interest rates need to reach for the interest burden as a proportion of gross primary income to be the same today as on the eve of the GFC. The answer varies, of course, by sector. According to our estimates, the general government cannot even afford a rate hike; it is clearly the most risky sector of the economy. This is not a surprise, as it has recorded the highest debt load and is therefore the most sensitive to rate hikes. It is literally carrying the weight of the crisis on its shoulders. On the other hand, the domestic nonfinancial private sector can absorb rate increases ranging from 1.8% for the nonfinancial non-corporate business to 3.5% for the nonfinancial corporate business. According to this approach, it therefore appears that the risk is concentrated on government debt, which might no longer be risk-free after all.
Indeed, even if interest rates were to remain unchanged until the end of time, the expansive fiscal policy of the Trump government, which is resulting in a huge budget deficit and a planned explosion of government debt, poses a long-term risk. U. S. government bonds, however, continue to inspire confidence. They offer a high degree of liquidity and their global reserve currency denomination guarantees them a special status. As the GFC shock reminds us, the world can change in a fortnight and never really looks the way it was before. As a result, U.S. government debt, and by extension the government debt of countries that have become heavily indebted due to the GFC and/or the euro crisis, has become much more risky.
Finally, the sensitivity of the value of assets to interest rates is the most important short-term risk and the most difficult to estimate. Household wealth has never been more tied to the financial markets and a wide-ranging equity market correction could plunge the U. S. economy into the next recession. Although, as is often said, financial markets have anticipated 15 of the last 10 recessions, it is fair to include changes in financial market trends in the macroeconomic scenario.
Conclusion
Economic fundamentals are still buoyant and the vast majority of leading indicators point towards robust growth. Inflation remains modest, but central banks are gradually taking a tougher line. Central banks’ confidence in their economic scenario – growth and inflation – has strengthened to the point that both the rise in U.S. interest rates and the end of the ECB's QE are now well anticipated.
Financial markets' sensitivity to interest rates has increased, as shown by the equity market correction observed in February. Given the high valuation of the assets, this is not a surprise.
We showed that the decline in interest rates that took place in the wake of the GFC has been an important factor in the restoration of the economy and the financial system. We believe that inflation figures should be monitored very closely over the next few quarters as they can lead to significant changes in both the valuation of financial assets and the economic cycle.
We started 2018 on a cautious note, and in the ensuing months, little has happened to change our view. We will remain in cautiously optimistic for the foreseeable future.
Author:

Please contact us at any time if you have questions or suggestions.
ETHENEA Independent Investors S.A.
16, rue Gabriel Lippmann · 5365 Munsbach
Phone +352 276 921-0 · Fax +352 276 921-1099
info@ethenea.com · ethenea.com
An investment in investment funds, as with all securities and comparable financial assets, carries the risk of capital or currency losses. The price of fund units and income levels will therefore fluctuate and cannot be guaranteed. The costs associated with fund investment affects the actual performance. Units are purchased solely on the basis of the statutory sales documentation (Key Investor Information, sales prospectuses and annual reports), which can be obtained free of charge in English from the fund management company ETHENEA Independent Investors S.A., 16 rue Gabriel Lippmann, L-5365 Munsbach, as well as from the Swiss representative: IPConcept (Schweiz) AG, In Gassen 6, Postfach, CH-8022 Zürich. The paying agent in Switzerland is DZ PRIVATBANK (Schweiz) AG, Münsterhof 12, Postfach, CH-8022 Zürich. All information published here constitutes a product description only. It does not constitute investment advice, an offer to enter into an agreement for the provision of advice or information or a solicitation of an offer to buy or sell securities. Contents have been carefully researched, compiled and checked. No guarantee for correctness, completeness or accuracy can be provided. Munsbach, 01.03.2018.